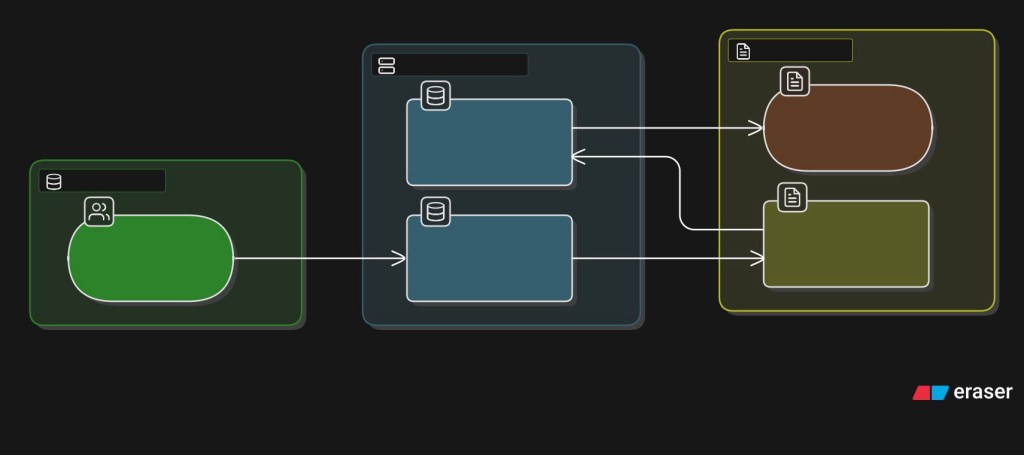
When working with diagrams it’s sometimes easier to Mermid to show the data flow.
graph TD
%% Nodes
B2[/Source: Customers/]:::green
D2([usp_GetCustomerData]):::blue
F2[/CustomerData/]:::yellow
H3([usp_JoinCustomerOrders]):::blue
J3[/CustomerOrders/]:::orange
%% Connections
B2 –> D2 –> F2 –> H3 –> J3
%% Styles
classDef green fill:#00cc66,stroke:#333,stroke-width:1px,color:#fff;
classDef blue fill:#3399ff,stroke:#333,stroke-width:1px,color:#fff;
classDef yellow fill:#ffcc00,stroke:#333,stroke-width:1px,color:#000;
classDef orange fill:#ff9900,stroke:#333,stroke-width:1px,color:#fff;
This code can be applied to https://www.eraser.io/ai/mermaid-diagram-editor to generate a data flow diagram.

Leave a comment